– continued from part 1.
Using the Linux High-Resolution timer API, I created my first implementation of a 100 Hz real-time loop in a Linux kernel module. It looked like this:
#include <linux/interrupt.h>
#include <linux/err.h>
#include <linux/irq.h>
#include <linux/clk.h>
#include <linux/list.h>
#include <linux/kthread.h>
#include <linux/sched.h>
#include <linux/rtmutex.h>
#include <linux/hrtimer.h>
#include <linux/delay.h>
static struct task_struct *thread_10ms;
static struct hrtimer timer;
static ktime_t kt;
uint8_t cancelCallback;
/**
* Thread for 10ms polling of bus devices
*/
static enum hrtimer_restart bus_10ms_callback(struct hrtimer *val) {
ktime_t now = ktime_get();
pollBusHardware();
hrtimer_forward(&timer, now, kt);
if(cancelCallback == 0) {
return HRTIMER_RESTART;
}
else {
return HRTIMER_NORESTART;
}
}
static int bus_rt_timer_init(void *arg) {
kt = ktime_set(0, 10 * 1000 * 1000); //10 ms = 10 * 1000 * 1000 ns
cancelCallback = 0;
hrtimer_init(&timer, CLOCK_MONOTONIC, HRTIMER_MODE_REL);
timer.function = bus_10ms_callback;
hrtimer_start(&timer, kt, HRTIMER_MODE_REL);
return 0;
}
int __init bus_timer_interrupt_init(void) {
struct sched_param param = { .sched_priority = MAX_RT_PRIO - 1 };
thread_10ms = kthread_create(bus_rt_timer_init, NULL, "bus_10ms");
if (IS_ERR(thread_10ms)) {
printk(KERN_ERR "Failed to create RT thread\n");
return -ESRCH;
}
sched_setscheduler(thread_10ms, SCHED_FIFO, ¶m);
wake_up_process(thread_10ms);
printk(KERN_INFO "RT timer thread installed.\n");
return 0;
}
void __exit bus_timer_interrupt_exit(void) {
cancelCallback = 1;
kthread_stop(thread_10ms);
printk(KERN_INFO "RT thread removed.\n");
}
The basic idea is: When the module is loaded (bus_timer_interrupt_init()), it creates a new thread (bus_rt_timer_init()), and configures it to use the real-time scheduler. The new thread then sets up a high-resolution timer with a 10 ms timeout, and bus_10ms_callback() as its callback function. Whenever the callback function is called, it does whatever needs to be done in the loop (in my case, pollBusHardware()), and restarts the timer with a new 10 ms timeout.
Testing it out
A few initial simple tests without any substantial system load showed everything to be working as intended – the loop was doing its thing pretty consistently on a 10 ms period. To be able to get some comparable and robust measurements, pollBusHardware() was made to access the onboard FPGA once every cycle. This access happens over the LPC bus, and should help provide realistic results, as this is basically what pollBusHardware() will be doing to poll its bus hardware.
The performance of the real-time loop can thus be measured by getting the FPGA to count the number of clockcycles in between each LPC access. This is something that an FPGA does just fine, as everything can be implemented directly in hardware (or gateware), and will thus inherently run in real-time. Since the FPGA has access to a 33 MHz clock (from the LPC bus), I expected the kernel loop period to be counted to around 330000 clockcycles ( = 33 MHz * 10 ms). For a start, I chose to simply count the number of 10 ms periods that deviated with 20% or more from this (that is, periods below 8ms (264000 clockcycles) and above 12ms (396000 clockcycles)), and display the count in ChipScope (which can monitor and display variables directly from the FPGA chip through a JTAG interface).
After loading the monitoring core into the FPGA, and then inserting the kernel module, ChipScope gives the following result (the system is unloaded):
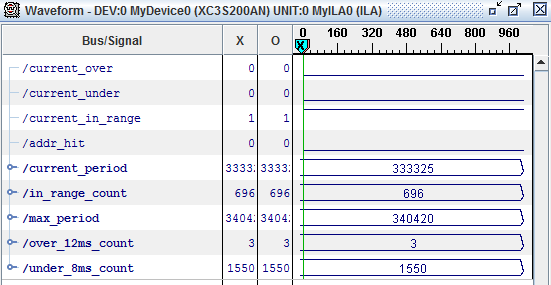
The interesting numbers are the in_range_count (the number of periods within the expected range), over_12ms_count (the number of periods above 12 ms) and under_8ms_count (the number of periods below 8 ms). Optimally, I’d want to have both over_12ms_count and under_8ms_count to be 0. There seems to be some initialization going on though, so for this implementation the counters always start out at 3 and 1550 respectively, but then remain stable (as long as the system is not loaded) while in_range_count increases at 100 counts per second. Also notice that the current_period counter is pretty close to the expected 330000 counts, and that the max_period counter is not too far away from the expected count either.
So, everything looks as expected. But until now, the system hasn’t been loaded at all, so let’s try that…
Putting on some stress
To stress the system, I’m using a combination of utilities (adapted from Ingo Molnars dohell script):
- hackbench
- rtc_wakeup
- du
- serialspammer (My own custom utility for sending random data over the two serial ports on the board. Mostly due to the serial controller being connected to the same LPC bus as the FPGA.)
- External flood ping (in this case using standard size, and preloading 100 packets).
I’ll admit that my knowledge of Linux internals is not good enough to fully comprehend whether this provides a nicely balanced load across all system resources, but it certainly provides a much higher load than our actual application, and, as will be seen in the following, succeeds just fine in stressing the system.
Running with this for about 30 seconds gives the following results: (initial counts are ~13500, 3 and 1550 for in_range_count, over_12ms_count and under_8ms_count respectively)
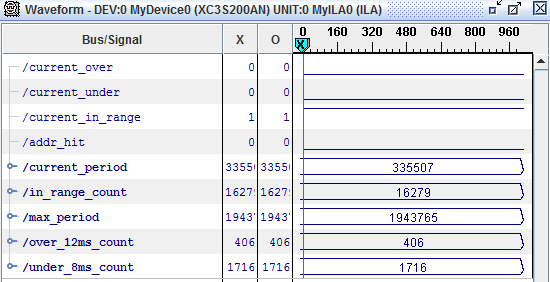
Ouch. Several hundred periods both above and below the specified ranges, and a measured max_period of 1943765 clockcycles (close to 60 ms).
That was not what I had hoped.
What’s wrong?
To find out more about what was wrong, I made a post to the linux-rt-users mailing list, in the hope that someone from there would be able to enlighten me – and it didn’t disappoint.
With the answers from the mailing list (special thanks to Frank Rowand for some very helpful pointers), I quickly realized the main culprit. When I initially wrote the code, I for some reason thought that starting the timer from a real-time thread would also make the timer and callback run with the real-time scheduler (I’m pretty sure I read somewhere that that would be the case, but of course I haven’t been able to find it again).
This is not true though. bus_rt_timer_init() will indeed run in real-time (due to the call to set_scheduler() in bus_timer_interrupt_init()), and will also kick of the timer, but after doing so, it will just exit without leaving any trace of real-time behavior behind. The loop is thus running with the default, non-rt scheduler, which probably also explains the lack of rt-performance.
So, I’d have to rethink my implementation…
– to be continued in part 3.